Written by:
Adam Galema
VP of Finance
Kinetic Advantage
View Adam’s Bio
Contents in this Article
No doubt, market conditions are tough. Since the timing of an economic recovery remains a complete unknown, it’s important that you are actively taking steps today to prepare your independent dealership to succeed in these tough times.
Learn what actions you can anticipate lenders to take in these uncertain times – and what you can do now to prevent your business from being painted with a broad brush.
First, let’s talk about the market conditions
As we enter 2024 in a period of slowed economic activity, we need to understand the main drivers and what factors we can – and cannot – control.
“This report confirmed what we already knew: The consumer went on a shopping spree in the third quarter.”
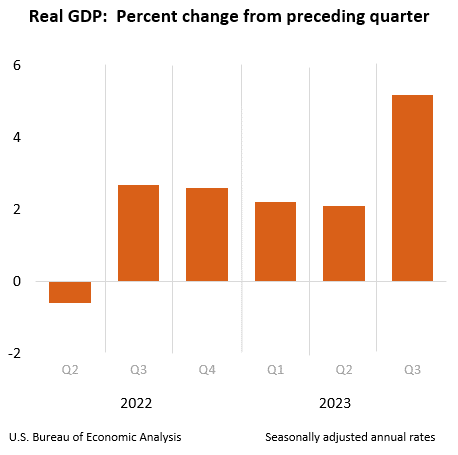
Real GDP
In simple terms, Real Gross Domestic Product (GDP) is an inflation-adjusted measure that reflects the value of all goods and services produced by an economy in a given year.
The U.S. GDP grew at a 5.2% annualized pace in the third quarter of 2023, ahead of the 4.9% estimate. The sharp increase was the result of consumer spending, increased inventories, exports, residential investment, and government spending.
The GDP increase marked the biggest gain since the fourth quarter of 2021.
Markets did not react much to the increase, with stocks mixed and Treasury yields mostly lower.

Source: Bureau of Economic Analysis | Dec 4, 2023
“This report confirmed what we already knew: The consumer went on a shopping spree in the third quarter,” said Michael Arone, Chief Investment Strategist for U.S. SPDR Business at State Street Global Advisors. “I don’t think anything in this report changes the outlook for monetary policy. That’s why I don’t think you’re seeing an overreaction from markets.”
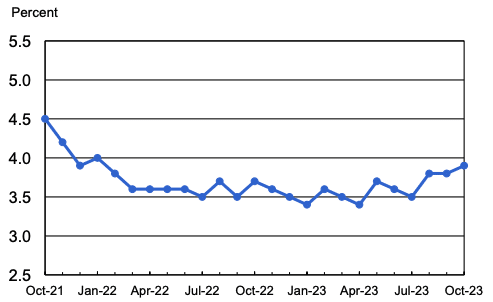
Unemployment Rate
Both the unemployment rate, at 3.9 percent, and the number of unemployed persons, at 6.5 million, changed little in October. However, since their recent lows in April, these measures are up by 0.5 percentage points and 849,000, respectively.
With that said, unemployment rates are on an upward trend since July and unemployed persons are higher now than they have been since the beginning of 2022, with trends suggesting that the higher unemployment rate may continue into 2024.

Note: Seasonally adjusted rate
Source: U.S. Bureau of Labor Statistics | Nov 3, 2023

Events Impacting the Auto Industry
2020
- Covid emerges
- GM, Ford & Chrysler halt production
- World shuts down
- PPP loans top $500B
2021
- 6 spending packages approved
2022
- Russia invades Ukraine
- Feds enact inflation reduction
2023
- UAW strike
Attempts to Reduce Inflation
One of the biggest impacts to the automotive industry right now is inflation.
Since March 2022, there have been 11 rate increases from .25% to the current 5.50%.
The current 5.5% Federal Funds Effective Rate has not been this high since August 2007.
Impact on Prices and Payments
According to the Federal Reserve Economic Data, the average amount financed for used car loans in Q1 2017 was $17,180.
In Q1 of 2023, that dollar figure was $23,537.
This is down from the height in Q3 2022 of $25,401 but is still a 37% increase over 6 years (and a 15% increase in just the last two years).
As the average amount financed has increased dramatically, so have average monthly car payments – with a 56% increase in the average used car payment and a 45% increase in new car payments.
Average New Car Payment
+$227
2023 – $729
2017 – $502
Average Used Car Payment
+$204
2023 – $569
2017 – $365
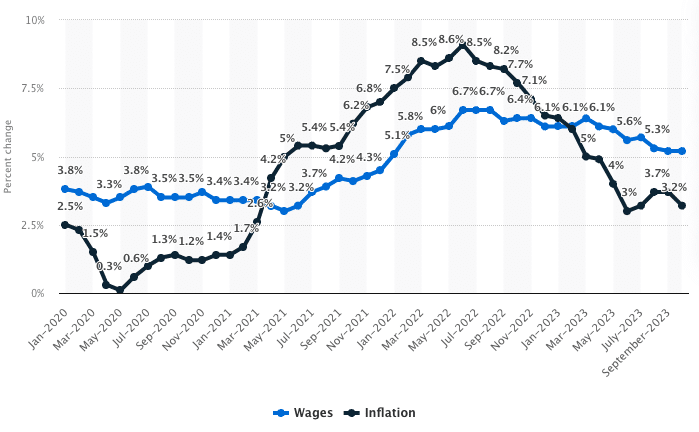
Difference Between the Inflation Rate and Growth of Wages
The high rates of inflation in 2022 had a significant impact on wages. As expected, many Americans reported feelings of concern over the economy and a worsening of their own financial situation (source: Statista).
The inflation we all felt in the United States (and around the world, for that matter) was mainly due to COVID-19 related supply chain constraints and market disruption resulting from Russia’s invasion of Ukraine. The monthly inflation rate for the U.S. reached a 40 year high in June 2022 at 9.1 percent, and annual inflation for 2022 reached eight percent. Without appropriate wage increases, Americans will continue to see a decline in their purchasing power.

Despite the level of wage growth reaching 6.7 percent in the summer of 2022, it has not been enough to curb the impact of even higher inflation rates. The federally mandated minimum wage in the United States has not increased since 2009, meaning that individuals working minimum wage jobs have essentially taken a cut for the last twelve years
The Result?
The pace of used car retail transactions has remained relatively consistent throughout 2023, with November’s SAAR of 18.3 million equaling last November.
New car sales are up 7% from one year ago, with a November SAAR of 15.3 million. In either case, vehicle sales remain well below pre-pandemic levels.
Internal Measures You Can Take to Maximize Profitability
Let’s explore the areas where you can apply focus during this economic period and the internal measures that you can control to maximize profitability.
Guidelines to Achieve Max Profitability
The three largest “profit robbers” that impact a dealer’s net earnings and cashflow.
Personal Expenses
Marketing Expenses
Payroll
How Do I Know if My Dealership is Profitable?
What are the metrics you need to use to determine if your business is profitable?
Assets
Liabilities
Working Capital
Net Earnings Potential
Potential Earnings Are Losses
What is it?
How is it calculated?

Average Daily Holding Costs
Each vehicle in your dealership’s inventory incurs a cost each day it remains in your inventory. Generally speaking, this holding cost is the sum of your fixed expenses and floorplan financing costs.
It is important to understand your daily holding cost to accurately calculate your profit per unit. In order to maximize profits, however, a dealership should focus on increasing turn time, as that will actually decrease the daily holding cost.
What is it?
How is it calculated?
Breakeven Measurement
To determine how long you can hold a unit in stock and still breakeven, take your average gross profit and divide it by your average daily holding cost.
Using the example above, we would take the average gross profit of $1,750 and divide it by $36.76 (the average daily holding cost) to get 47.61 – the total number of days a vehicle can remain in inventory before it becomes unprofitable.
See It in Action
Bringing it All Together
Let’s take a look at some industry benchmarks that will help you measure your success.
Managing Expenses
Questions to ask yourself about personnel expenses
Leverage Your Balance Sheet as a Key Management Tool
Strongest Considerations
“
It sounds extraordinary, but it’s a fact that balance sheets can make fascinating reading.”
Mary Archer
Vehicle Guidelines to Achieve Max Profitability
24%
Max Compensation
(not including management)
10%
Salaries
(management)
30-36%
Total Employment Compensation
(including managers)
1.8%
Policy Work
12%
Advertising
2%
Floorplan Interest
What Drives You?
What Drives You?
The dealership floorplanning newsletter that takes a look into recent floorplan news & trends, as well as updates from inside the walls at Kinetic Advantage.
(We promise not to spam you or inundate your inbox with emails. Our newsletter goes out roughly twice per month to include important news and information around dealer floorplanning.)


